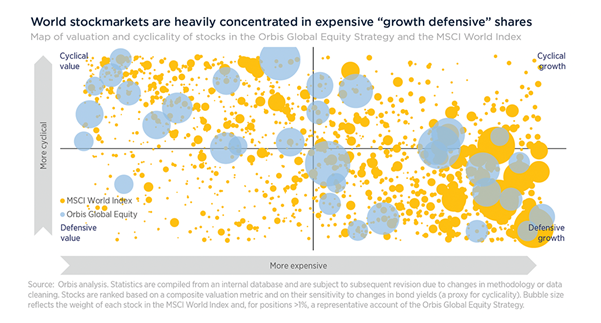
Four years ago, we introduced our "bubbles" chart to show how the market had become concentrated in one type of stock and one view of the future. The chart maps every stock in the MSCI World Index, with the size of each bubble representing a stock's weight in the Index. Cheaper stocks are on the left, and richer ones on the right, with defensives at the bottom and cyclicals at the top.
In 2020 we wrote that the market had become concentrated in the "defensive growth" quadrant on the bottom right, particularly among lockdown beneficiaries, like Netflix and Amazon, whose positions looked unassailable.
That period also saw the rise of pandemic darlings such as Zoom and Peloton—where valuations looked exuberant to say the least. At one point, the exercise bike maker was valued more highly than Honda Motor, the world's largest motorbike maker (and a pretty big automaker too). The prices of lockdown darlings subsequently collapsed, as did those of speculative SPACs, meme stocks, non-fungible tokens, and hundreds of crypto currencies.
Over the past year, some of that market exuberance has returned. In equities, artificial intelligence is now the dominant theme, but signs of froth abound, spurred by the US election. Bitcoin's price has blown past previous records. Tesla, which a few months ago was facing relegation from the Magnificent Seven, has added $200bn to its market value since the election—despite earnings expectations declining. And, thanks to the Tesla CEO's role at the new Department of Government Efficiency, or DOGE, the joke cryptocurrency dogecoin has seen its price surge by 150%.
All that to say, while much has changed since 2020, much remains the same. A few years on, our bubbles chart tells the same story, and today over 60% of the World Index sits in the "defensive growth" quadrant. Investors remain focused on one theme and one view of the future, and seem more afraid of missing out than losing money.
So what is an active investor to do? Some are becoming active with passive characteristics—we have heard several cases of investors simply buying the Magnificent Seven to the index weight, a decision that explicitly ignores price and fundamentals. Providers of exchange traded funds are making that easier, introducing super concentrated funds that only own the biggest stocks. Throwing investing basics out the window does not typically end well.
The global stock market is a big place, and we think it's unlikely that the most richly-valued part of it has a monopoly on good opportunities. In contrast, our bottom-up process has uncovered opportunities across all four corners of the market—the blue bubbles in the chart.
As a sample, the Korean banks sit across the "value cyclical" and "value defensive" buckets. Some quality companies like Nintendo are in the "growth cyclical" quadrant, while a handful of owner-led businesses such as Corpay, RXO, GXO, and XPO sit in the "growth defensive" bucket.
Rather than being concentrated in similar stocks, our portfolio is well diversified across characteristics, regions, and sectors. Crucially, we believe that every stock in the portfolio trades at a discount to its intrinsic value. In many cases, we are paying low price-to-earnings multiples on cyclically depressed earnings. Such stocks offer the potential for a double win, as both earnings and valuations recover. This stands in stark contrast to some of the high-flying stocks in the Index, where expectations for stellar growth are already baked into the price. Paying a high multiple on cyclically high earnings is a dangerous game.

DISCLAIMER:
Past performance is not a reliable indicator of future results. The value of investments in the Orbis Funds may fall as well as rise and you may get back less than you originally invested.


